 2020 Profit Survey and Report 2020 Profit Survey and Report
New for 2020: NFDA Financial Benchmarking Dashboard
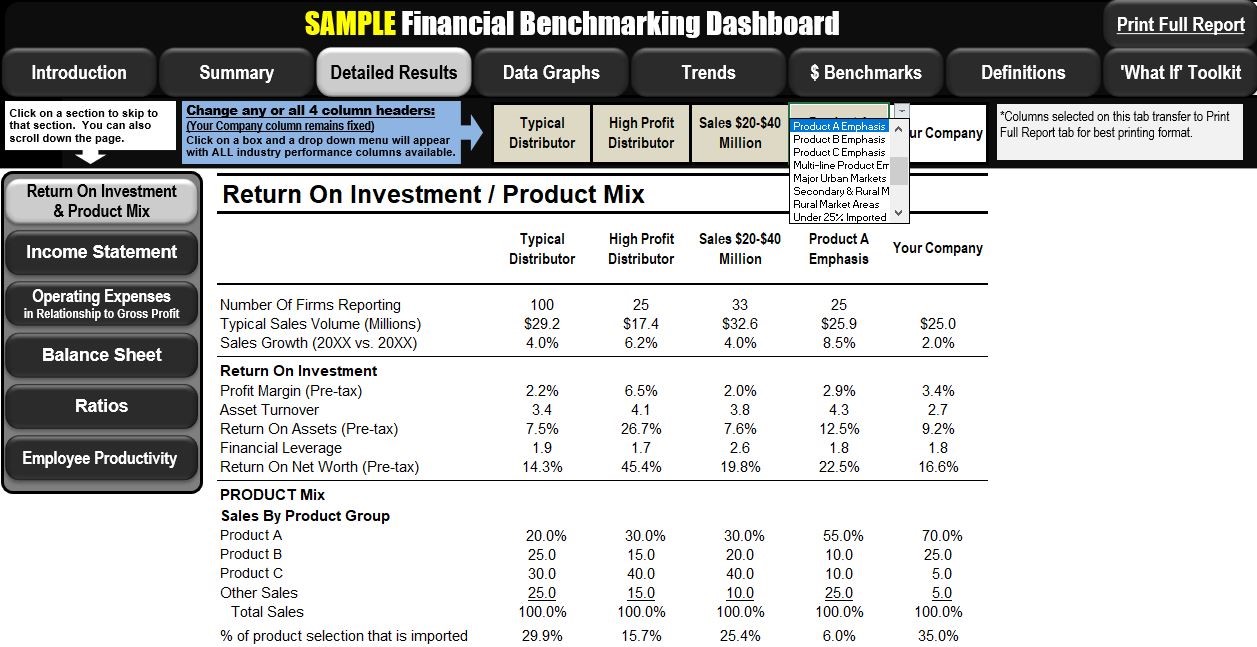
New this year, the 2020 NFDA Financial Benchmarking Report will be delivered in an Excel© dashboard that allows you to create customized reports in a more efficient in a user-friendly format. The interactive dashboard allows you to select just the specific columns of data you need to benchmark against your company.
Dashboard Highlights
- Navigation buttons allow you to jump to a specific section of study. Five drop-down headers permit you to select the columns of data that apply to your company.
- Data visualization and interactive graphics enable you to instinctively see previously hidden patterns.
- Once you have selected the columns to benchmark against your company, the result is a short but detailed report customized for your needs.
|